We have a client with Antagonist in Holland and it has had multiple brief downtimes over the last couple of weeks. We are already no longer using Slimstat as it seemed to be rather demanding memory wise. But the downtimes still continued. “PHP Fatal error: Allowed memory size of x bytes exhausted” was the key error we found out. Here is how we dealt with it.
Allowed Memory Size Exhausted
As stated we soon saw in the logs that there was an issue with the PHP memory limit set. We got too many well known general errors like:
PHP Fatal error: Allowed memory size of x bytes exhausted
We found this specific error using WP Debug in the debug.log file:
[02-Dec-2016 03:38:22 UTC] PHP Fatal error: Allowed memory size of 268435456 bytes exhausted (tried to allocate 20480 bytes) in /home/account/domains/domain.com/public_html/wp-includes/wp-db.php on line 1832
and another one an hour later:
[02-Dec-2016 04:08:50 UTC] PHP Fatal error: Allowed memory size of 268435456 bytes exhausted (tried to allocate 20480 bytes) in /home/account/domains/domain.com/public_html/wp-includes/wp-db.php on line 1832
WP DB
The file wp-db.php the error refers to is the file used to interact with the database. It is based on the ezSQL class by Justin Vincent. It contains the useful global $wpdb There is a Codex article on it as well. There on the line 1832 of wp-db.php you will find:
while ( $row = mysqli_fetch_object( $this->result ) ) {
 $this->last_result[$num_rows] = $row;
 $num_rows++;
 }
That does mean that during a database fetch query more memory than allowed was asked for. This is still rather vague though and does not help much. More on a better analysis option a little later.
When we checked the general error log we only found:
Fri Dec 02 00:11:18.364110 2016] [ssl:warn] [pid 689240] AH01909: www.domain.com:443:0 server certificate does NOT include an ID which matches the server name
[Fri Dec 02 04:49:58.434566 2016] [include:error] [pid 683238] [client 180.163.220.62:8886] unable to include "/403.shtml" in parsed file /opt/error_pages/403_antagonist.shtml, subrequest setup returned 403, referer: http://domain.com/?cat=44&paged=2
This error is not related to the issue though. And as the Antagonist cycles the logs rather quickly we will have to wait for more useful logs to show up.
Raising PHP Memory
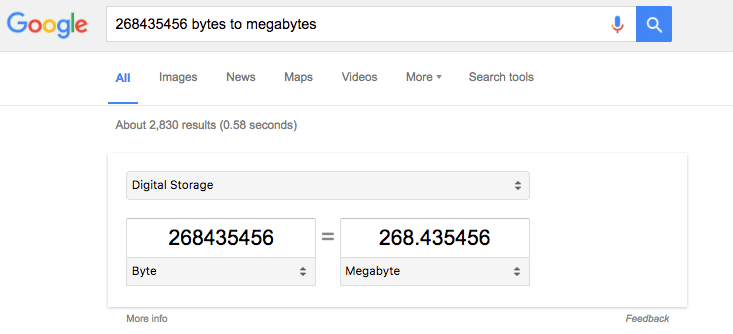
So clearly we needed to raise the memory. This at least to avoid downtime. First we had to find out the amount of RAM used in DirectAdmin*. When you convert the bytes to megabytes you will see it passes 256MB:

Location to check the PHP RAM limit varies from hoster to hoster. So is the place where you can raise memory usage for PHP. Some hosters will allow you to raise PHP memory in .htaccess or a custom php.ini file, others give you full root access to change the core php.ini.
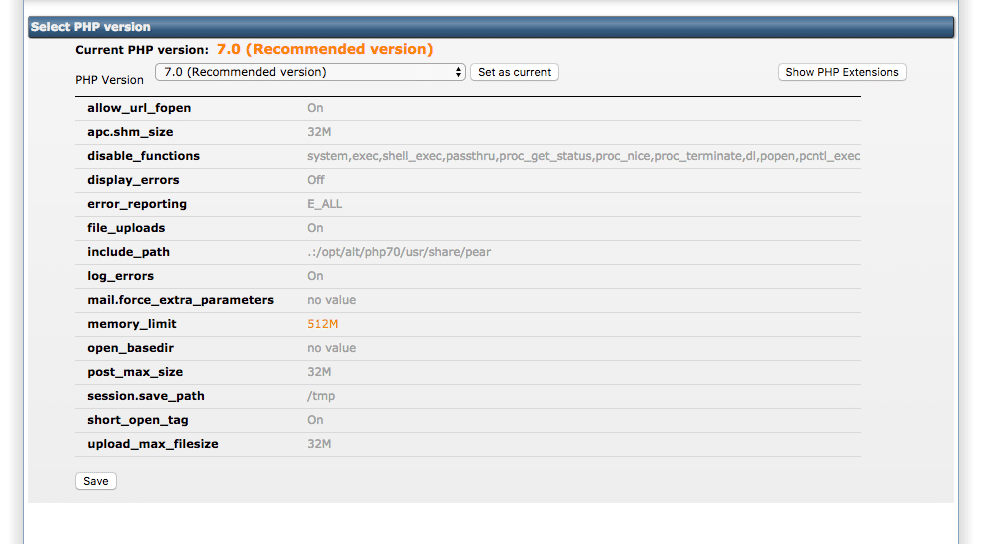
When we checked the PHP settings in DirectAdmin – where Antagonist allow you to change it – we found out the limit was set at a puny 128MB so we raised it to 512MB:

We do prefer max 256MB for most non e-commerce sites though so we will start monitoring things more to figure out why this is happening.
WordPress Memory Limit
If this did not help you probably have to add one or two lines of code to wp-config.php to tell WordPress to really use the extra RAM given (Codex Article). In our case we may add the following if need be:
define( 'WP_MEMORY_LIMIT', '512M' );
With most of our WooCommerce setups this is needed. In the case of memory allocation issues like ours we probably can just stick to change in PHP config itself.
Analysing Higher RAM Demand
To figure out what plugin or queries are the most demanding I normally use two plugins:
P3 Profiler has unfortunately not been updated in over 2 years so is no 100% very reliable. But still a great plugin that shows what your plugins and theme is using as a percentage of the whole.
The Query Monitor is more detailed as it will really show what particular queries are very demanding. Is a better option if you are the theme or plugin developer and want to improve the overall performance of your baby. For end users it is however more difficult to put to good use.
NB We are focussing here on backend stuff as the issue is related to database queries. For frontend stuff and site performance you can use tools like GMetrix, Chrome Inspector. Also See this article for more .
Causes of Higher RAM Demand
Normally a plugin like Wordfence doing security scans, a statistics plugin like Slimstat or a backup plugin like BackupBuddy are the culprit as they all demand more than the average plugin. Site scans and backups as well as dealing with site traffic statistics tend to demand a lot. Lot’s of queries being fired, lots of I/O. That does not mean that these aren’t great plugins though. Some hosters just limit you quite a bit on memory or I/O (Especially GoDaddy!). Especially shared hosters.
In our case it was Wordfence demanding a bit more of the site every now and then. That and some heavy brute force password attacks that come and go. We are limiting the failed login attempts more now and we are considering stopping the use of Wordfence though we really love it.
Solutions
If you want to keep on working with these or other demanding plugins you often need to upgrade your hosting package. Dropping the use of certain plugins tends to go only so far as some you simply cannot live without. So upgrade when need be. Unless there is space for the hoster to give you more RAM and they are willing too. You should at least be able to get 256MB. Even 512MB for running WooCommerce.
If you are on shared hosting, well, that often means you will need to upgrade to a better package. That has been my and my clients’ experience. In the end a better package, especially on a VPS or managed WordPress hosting service, will be best for most of you.


